


Page 19 - LCP Annual Report & Accounts 2026
P. 19
 Financial
Review
The Group has experienced continued growth in FY26, reflected in its financial performance and the increase in its portfolio value, with the strength of its balance sheet maintained.
PERFORMANCE REVIEW
LCP has performed very well in FY26 with strongly increased turnover and increased profit before tax.
The Group considers underlying PBT an important KPI, as it closely correlates to underlying cashflow.
Despite continued economic headwinds including persistent inflation and consequently interest rates remaining above recent historical levels, the Group has improved its underlying PBT. Change to underlying profits of the Group are shown before fair value movements and other non-recurring items (see note 11).
KPI’S
The Group tracks, in particular, the following KPIs:
TURNOVER
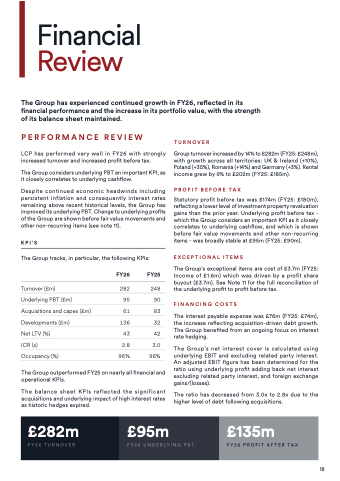
Group turnover increased by 14% to £282m (FY25: £248m), with growth across all territories: UK & Ireland (+10%), Poland (+35%), Romania (+14%) and Germany (+3%). Rental income grew by 9% to £202m (FY25: £185m).
PROFIT BEFORE TAX
Statutory profit before tax was £174m (FY25: £180m), reflecting a lower level of investment property revaluation gains than the prior year. Underlying profit before tax - which the Group considers an important KPI as it closely correlates to underlying cashflow, and which is shown before fair value movements and other non-recurring items - was broadly stable at £95m (FY25: £90m).
EXCEPTIONAL ITEMS
The Group’s exceptional items are cost of £3.7m (FY25: Income of £1.6m) which was driven by a profit share buyout (£3.7m). See Note 11 for the full reconciliation of the underlying profit to profit before tax.
FINANCING COSTS
The interest payable expense was £76m (FY25: £74m), the increase reflecting acquisition-driven debt growth. The Group benefited from an ongoing focus on interest rate hedging.
The Group’s net interest cover is calculated using underlying EBIT and excluding related party interest. An adjusted EBIT figure has been determined for the ratio using underlying profit adding back net interest excluding related party interest, and foreign exchange gains/(losses).
The ratio has decreased from 3.0x to 2.8x due to the higher level of debt following acquisitions.
  Turnover (£m)
Underlying PBT (£m)
Acquisitions and capex (£m)
Developments (£m)
Net LTV (%)
ICR (x)
Occupancy (%)
FY26 FY25
282 248
95 90
61 83
136 32
43 42
2.8 3.0
96% 96%
       The Group outperformed FY25 on nearly all financial and operational KPIs.
The balance sheet KPIs reflected the significant acquisitions and underlying impact of high interest rates as historic hedges expired.
 £282m
FY26 TURNOVER
 £95m
FY26 UNDERLYING PBT
 £135m
FY26 PROFIT AFTER TAX
18


