


Page 17 - LCP Annual Report & Accounts 2026
P. 17
SITE-LEVEL ENERGY SAVING INITIATIVES
At larger retail assets with on-site management teams, the Group implements targeted energy efficiency measures including lighting rationalisation, LED lighting, BMS, HVAC controls, PIRs and detection controls.
LOW EMISSIONS FLEET
Our vehicle fleet continues to support the transition to lower-carbon business operations, with 44% of vehicles fully electric, 40% plug-in hybrid and a further proportion incorporating fuel-saving hybrid technology. Alongside fleet electrification, our Pool Car Scheme promotes more efficient use of shared vehicles, reducing unnecessary travel impacts. This approach is reinforced by our EV Charging Point Policy and responsible charging practices, helping to embed sustainable travel choices across the Group.
UK STREAMLINED ENERGY & CARBON REPORTING
This report summarises LCP Group’s energy consumption, greenhouse gas emissions, energy efficiency initiatives and energy performance in accordance with the UK Government’s Streamlined Energy and Carbon Reporting (SECR) framework. To achieve complete reporting coverage, 4.79% of total energy consumption data has been estimated.
Under SECR requirements, LCP Group reports landlord- attributable energy consumption and associated emissions from UK properties it owns, occupies and operates, together with emissions arising from fleet vehicle use and business travel.
Although not all LCP Group entities met the regulatory thresholds for SECR reporting in FY26, the Group elected to report energy consumption and emissions across all UK assets and operations in preparation for ESOS Phase 4 reporting, in December 2027. This approach establishes a new baseline for energy and carbon reporting and, therefore, year-on-year comparisons are not applicable.
Further information including methodologies used in the calculation of disclosures is provided in LCP’s FY26 SECR Report.
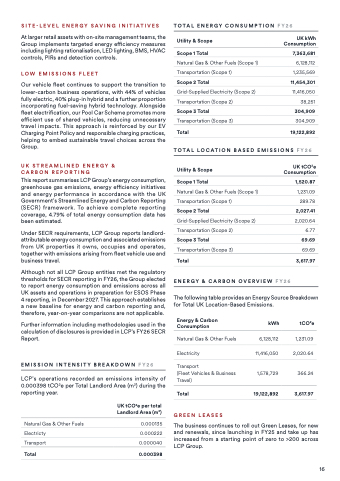
EMISSION INTENSITY BREAKDOWN FY26
LCP’s operations recorded an emissions intensity of 0.000398 tCO2e per Total Landlord Area (m2) during the reporting year.
TOTAL ENERGY CONSUMPTION FY26
 Utility & Scope
Scope 1 Total
Natural Gas & Other Fuels (Scope 1)
Transportation (Scope 1)
Scope 2 Total
Grid-Supplied Electricity (Scope 2)
Transportation (Scope 2)
Scope 3 Total
Transportation (Scope 3)
Total
UK kWh Consumption
7,363,681
6,128,112
1,235,569
11,454,301
11,416,050
38,251
304,909
304,909
19,122,892
          TOTAL LOCATION BASED EMISSIONS FY26
 Utility & Scope
Scope 1 Total
Natural Gas & Other Fuels (Scope 1)
Transportation (Scope 1)
Scope 2 Total
Grid-Supplied Electricity (Scope 2)
Transportation (Scope 2)
Scope 3 Total
Transportation (Scope 3)
UK tCO2e Consumption
1,520.87
1,231.09
289.78
2,027.41
2,020.64
6.77
69.69
69.69
         Total 3,617.97
ENERGY & CARBON OVERVIEW FY26
The following table provides an Energy Source Breakdown
  for Total UK Location-Based Emissions.
Energy & Carbon Consumption
Natural Gas & Other Fuels
Electricity
Transport
(Fleet Vehicles & Business Travel)
Total
GREEN LEASES
kWh
6,128,112
11,416,050
1,578,729
19,122,892
tCO2e
1,231.09
2,020.64
366.24
3,617.97
       Natural Gas & Other Fuels
Electricty
Transport
Total
UK tCO2e per total Landlord Area (m2)
0.000135
0.000222
0.000040
0.000398
The business continues to roll out Green Leases, for new and renewals, since launching in FY25 and take up has increased from a starting point of zero to >200 across LCP Group.
    16


